Oncomedicine 2017; 2:111-120. doi:10.7150/oncm.20045 This volume Cite
Research Paper
MicroRNA Profiling of Oxaliplatin-Resistant HCT116 Colorectal Cancer Cells
Bustamin Kosmo1, Kee Wah Lee2, Muhammad Sufyan bin Masroni2, Sharne Leong1, Wei Ern Ong1, Hong Lyn Wong1, Yi Yun Chang1, Evelyn SC Koay1, 2, Sai Mun Leong2, Karen Tan1 ![]()
1. Department of Laboratory Medicine, National University Hospital, Level 3 NUH Main Building, 5 Lower Kent Ridge Road, Singapore 119074, Singapore;
2. Department of Pathology, Yong Loo Lin School of Medicine, National University of Singapore, Level 3 NUH Main Building, 5 Lower Kent Ridge Road, Singapore 119074, Singapore.
Received 2017-3-12; Accepted 2017-5-12; Published 2017-6-21
Abstract
Aim: To investigate the impact of oxaliplatin resistance on the cellular characteristics and miRNA expression pattern in colorectal cancer cells.
Methods: A stable oxaliplatin-resistant colorectal cancer HCT116 cell line was established by exposure to increasing doses of oxaliplatin. Alterations in cytotoxicity, migration, invasion and tumorsphere formation were assessed by MTS assay, modified Boyden chamber assay, and colonosphere assay respectively. The miRNAome of the oxaliplatin-resistant HCT116 cells was analyzed using the TaqMan PCR Human miRNA array. Upregulated miRNAs from the PCR array were validated by real-time reverse transcription-quantitative PCR (RT-qPCR).
Results: Oxaliplatin-resistant HCT116 cells exhibited higher migration, invasion and tumorsphere formation compared to parental oxaliplatin-sensitive HCT116 cells. The oxaliplatin-resistant cells showed a distinct miRNA expression profile compared to the parental cells. The expression of miR-601, miR-222, miR-202 and miR-25 were verified by RT-qPCR to be increased in resistant cells. Bioinformatics analyses were used to identify potential target mRNAs of these 4 miRNAs.
Conclusion: Results presented in this study provide evidence that oxaliplatin-resistance induces phenotypic changes in colorectal cancer and alterations in miRNA expression. Functional studies on the miRNAs and their target mRNA may enable the discovery of functional pathways to chemoresistance in colorectal cancer.
Keywords: Colorectal cancer, oxaliplatin, chemoresistance, miRNA profiling, HCT116.
Introduction
Colorectal cancer (CRC) is the third most common cancer and the fourth most common cause of cancer-related death worldwide [1]. First line chemotherapy for metastatic CRC includes the combinations of fluorouracil, leucovorin, and irinotecan (FOLFIRI), fluorouracil, leucovorin, and oxaliplatin (FOLFOX), capecitabine and oxaliplatin (XELOX), and the combination of fluorouracil, leucovorin, oxaliplatin, and irinotecan (FOLFOXIRI) [2]. The use of these combination therapies for metastatic CRC have led to response rates of >50% and median survival of up to 2 years [3,4]. However, practically all metastatic CRC become resistant to chemotherapy [5].
Oxaliplatin is a third-generation platinum compound that forms DNA adducts and induces cellular apoptosis [6]. Resistance mechanisms reported for oxaliplatin include increased nucleotide excision repair of DNA lesions e.g., mediated by ERCC1 [7]; however no biomarkers of oxaliplatin resistance have been identified to sub-classify CRC patients for selection of chemotherapy. Therefore it is important to discover the molecular mechanisms and associated biomarkers of resistance to identify patients who are unlikely to respond to oxaliplatin but also to develop new treatments to overcome oxaliplatin resistance.
MicroRNAs (miRNAs) are small (18-25 nucleotides), noncoding RNAs that regulate the expression of their target genes by inhibiting translation or cleaving messenger RNA (mRNA), through interaction with the 3' untranslated regions (UTRs) of the target mRNAs [8]. MiRNAs can simultaneously regulate multiple targets and biological networks, and several miRNAs can cooperatively regulate a single mRNA target [8]. Expression profiling of human tumors has identified miRNA signatures associated with diagnosis, progression, prognosis and response to treatment [9].
There are several lines of evidence for the importance of miRNAs in regulating biological processes related to the sensitivity of tumor cells to chemotherapeutic drugs [10]. Multiple signaling networks have been suggested to collectively provide a plausible mechanism for chemotherapy resistance, cancer stem cell survival, invasiveness and metastases [11]. Because of the pleiotropic roles of miRNA in signaling networks, we hypothesize that miRNAs are involved in the cellular alterations that occur during the process of chemoresistance acquisition. To test this hypothesis, we developed an oxaliplatin-resistant HCT116 colorectal cancer cell line from the parental chemosensitive HCT116 cell, investigated the cellular alterations, and performed high throughput miRNA expression profiling to identify miRNAs associated with chemoresistance.
Materials and Methods
Generation of resistant cell line
HCT116 human colon carcinoma cells were obtained from the American Type Culture Collection. The cells were cultured in McCoy's 5A Medium (Lonza, Switzerland) supplemented with 10% fetal bovine serum (Gibco®, USA) and 2mM glutamine (Lonza, Switzerland) at 37°C in 5% CO2. Oxaliplatin (5 mg/ml) was obtained from the National University Hospital Singapore pharmacy and stored at 4°C, protected from light. The oxaliplatin resistant HCT116 cell line was generated in our laboratory by exposing parental HCT116 cells to an initial concentration of 2 µM oxaliplatin and culturing the surviving cells to a confluency of 80% over 2 passages. The surviving cells were then exposed to gradually increasing concentrations of oxaliplatin from 3 µM to 6 µM over a period of 90 days. The cell lines were passaged 2 times at each concentration and cell vials were frozen at each increase in concentration. The oxaliplatin resistant cells were cultured in McCoy's 5A Medium supplemented with 10% fetal bovine serum and 2mM glutamine at 37°C in 5% CO2 and maintained by adding 6 µM oxaliplatin after every 2 passages.
Chemosensitivity assay
In vitro drug sensitivity was determined using the Promega Cell Proliferation MTS Assay (Promega, USA). SN-38 (Sigma-Aldrich, USA) was dissolved in dimethyl sulfoxide (DMSO) and stored at -20°C. 5-fluorouracil (5-FU) (50 mg/ml) was obtained from the National University Hospital Singapore pharmacy and stored at room temperature (25°C), protected from light. Cells were seeded in 96-well plates at a density of 5 X 10³ per well and a range of drug concentrations of oxaliplatin or SN-38 were added the following day. Following 72 h of drug exposure, the medium was changed and the cells were incubated with 20 µl of MTS solution for 1 h. Absorbance at 492 nm was measured and the cell viability was compared to untreated cells. The experiment was performed in triplicates and the mean cell viability ± standard deviation was determined. The concentration of drug resulting in 50% inhibition of control growth (IC50) was calculated. Comparison between the parental and resistant cell lines was done using unpaired Student's t-test (p < 0.05 considered significant).
Migration assay
Cell migration was assessed using ibidi culture inserts (ibidi, GmbH, Denmark). An ibidi culture insert was placed into a well of a 24-well plate (Corning, USA) and lightly pressed to ensure tight adhesion. Cells were plated at a concentration of 1 X 10⁵ cells per ml, and after 24 h of incubation, culture inserts were removed, leaving behind a 500 µm-wide cell-free gap. The medium was changed to McCoy's 5A Medium with 2% fetal bovine serum and photographs of the movement of the cells into the cell-free gap were taken every 24 h until the gap had closed using a Nikon light microscope. The quantitative values of the gap size were calculated using the web-based WimScratch module of Wimasis online software [12]. The experiment was performed three times and the mean wound area ± standard deviation was determined. Comparison between the parental and resistant cell lines was done using unpaired Student's t-test (p < 0.05 considered significant).
Invasion assay
Cell invasion was assessed using ECMatrix Cell Invasion Assay (Millipore, USA). Cells were resuspended in McCoy's 5A Medium to 5 X 10⁴ cells in the upper well of the Transwell migration chamber (Millipore, USA). McCoy's 5A Medium with 10% fetal bovine serum was placed in the lower well as a chemoattractant. After 24 h, the upper wells were removed and the cells in the lower wells were stained with hematoxylin and photographed using a Nikon light microscope. The area covered by the cells was quantified using Adobe Photoshop. The experiment was performed three times and the mean cell area ± standard deviation was determined. Comparison between the parental and resistant cell lines was done using unpaired Student's t-test (p < 0.05 considered significant).
Sphere formation assay
Cells were plated at 1000 cells per well in 24-well ultralow attachment plates (Corning, USA) in stem cell medium. Stem cell medium consisted of 70% McCoy's 5A Medium, 30% Ham's F-12 Medium (Lonza), B-27 supplement (ThermoFisher, USA), 10% penicillin/streptomycin, 1% methylcellulose, epidermal growth factor (EGF; 10 ng/ml) and basic fibroblast growth factor (bFGF; 10 ng/ml). After 8 days, the wells were photographed using a Nikon light microscope. The area covered by the cells was quantified using Adobe Photoshop. The experiment was performed three times and the mean sphere area ± standard deviation was determined. Comparison between the parental and resistant cell lines was done using unpaired Student's t-test (p < 0.05 considered significant).
RNA extraction
Total RNA was extracted from each cell line using the Taqman® Gene Expression Cells-to-CT™ Kit (Thermo Fisher Scientific, USA) according to the manufacturer's instruction. RNA concentration and quality were determined using a NanoDrop 8000 UV-Vis spectrophotometer (Thermo Fisher Scientific, USA).
MiRNA expression profiling using TaqMan array
MiRNA expression profiling was performed using TaqMan® Array Human MiRNA Card Set v3.0, a preconfigured 2-microfluidic card set (A and B) containing 754 unique assays specific to human miRNAs (Thermo Fisher Scientific, USA). MiRNA was reversed transcribed using the miRNA reverse transcription kit (Applied Biosystems, USA) combined with the Megaplex Primer Pools A and B, according to the manufacturer's protocol. Pre-amplification was performed using the Megaplex PreAmp Primers Human Pool Set v3.0 (Thermo Fisher Scientific, USA) according to the manufacturer's protocol. The pre-amplification product was diluted in Tris-EDTA buffer, mixed with TaqMan Universal PCR Master Mix No AmpErase UNG (Life Technologies, USA), and loaded into the Microfluidic Array Cards according to the manufacturer's instruction. PCR reactions were performed on the QuantStudio™ 12K Flex Real-Time PCR system. Data from the TaqMan® Human Array MiRNA Cards were analyzed using DataAssist™ Software v1.0 (ThermoFisher Scientific) and the data was normalized using the global normalization function [13].
MiRNA quantitative real-time PCR
Selected miRNAs identified by the TaqMan® Human MiRNA Array were validated with reverse transcription - quantitative real-time PCR (RT-qPCR). MiRNA RT-qPCR was performed using IDEAL miRNA assays (MiRXES, Singapore) [14], according to the manufacturer's protocol. The real-time PCR assay was performed using the QuantStudio™ 12K Flex Real-Time PCR system. The relative miRNA expression was calculated using the comparative Cq method (fold change = 2-ΔCq) [15]. The fold change of miRNA expression of the resistant cell line was expressed relative to that of the parental cell line. The experiment was performed three times and the mean relative fold change ± standard deviation was determined. Comparison between the parental and resistant cell lines was done using unpaired Student's t-test (p < 0.05 considered significant).
In silico analyses of potential mRNA targets
Potential mRNA targets of the candidate miRNAs were obtained from miRTarBase (last accessed 10 Feb 2017) [16]. Potential mRNA targets were analyzed using the DAVID functional annotation tool (last accessed 10 Feb 2017) [17,18] by the KEGG pathway.
Results
Generation and phenotypic characterization of oxaliplatin-resistant HCT116 human colorectal cells
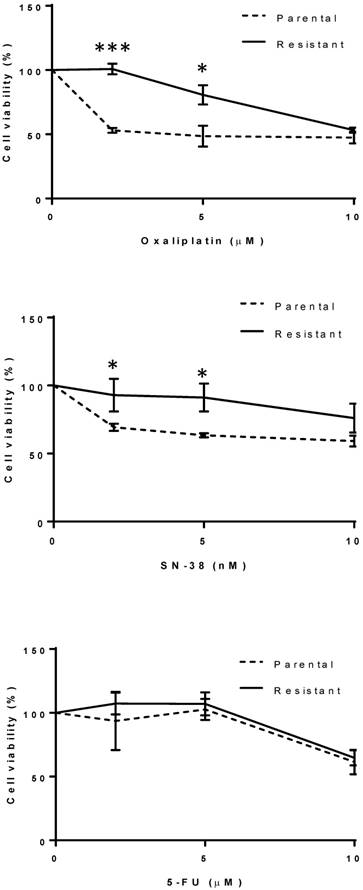
The oxaliplatin-resistant HCT116 cell line was generated by exposing the sensitive parental cell line to increasing concentrations of oxaliplatin from 2 µM to 6 µM over a period of 3-4 months. Drug sensitivities towards oxaliplatin and SN-38, the active metabolite of irinotecan, were measured for each cell line (Fig. 1). Parental HCT116 cells were significantly more sensitive to oxaliplatin at 2 and 5 µM compared to the resistant HCT116 cells (p < 0.001) (Fig. 1). The IC50 of oxaliplatin-resistant cells and parental cells for oxaliplatin were calculated to be 10 µM and 5 µM respectively. Parental HCT116 cells also appeared more sensitive to SN-38 at 2 and 5 nM, compared to the resistant HCT116 cells (p < 0.05) (Fig. 1). The IC50 of oxaliplatin-resistant cells and parental cells for SN-38 were 10 nM and 7 nM respectively. There was no difference in sensitivity to 5-FU at 2 and 5 µM between the oxaliplatin-resistant and the parental HCT116 cells (Fig. 1). The IC50 was 13.5 µM for both the oxaliplatin-resistant cells and parental cells for 5-FU.
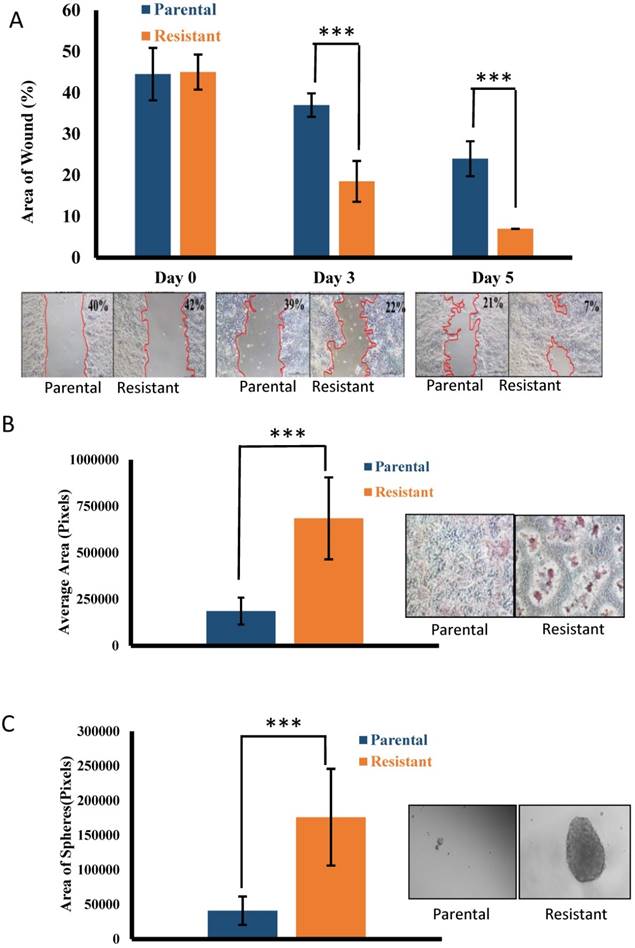
Previous studies have shown that acquired drug resistance can facilitate invasion and migration of colorectal cancer cells [19], therefore we compared the migratory and invasive capacities of the resistant HCT116 cells to the parental HCT116 cells. Resistant HCT116 cells exhibited an increased migratory rate compared to parental HCT116 cells (p < 0.001) (Fig. 2A). Resistant HCT116 cells also exhibited an increased capacity to invade compared to the parental HCT116 cells (p < 0.001) (Fig. 2B). Cancer stem cells (CSCs) have the ability to form colonies, or spheres, in the absence of serum without attachment to culture plates [20]. We evaluated the ability of the resistant and parental HCT116 cells to grow colon cancer cell spheres under serum-free conditions. Oxaliplatin-resistant HCT116 cells showed an increased ability to form spheres compared to parental HCT116 cells (p < 0.001) (Fig. 2C).
MiRNA profiling of oxaliplatin-resistant HCT116 cells
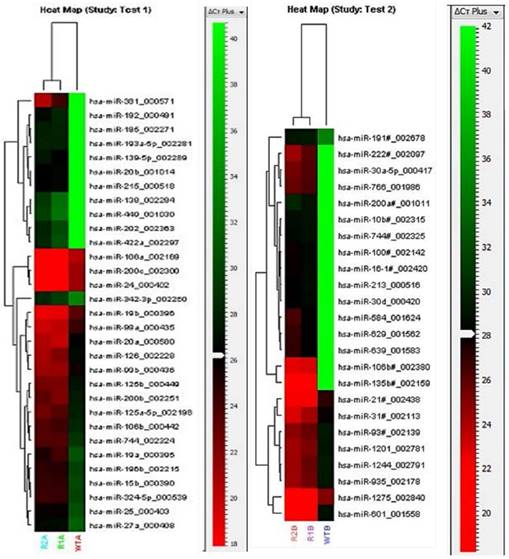
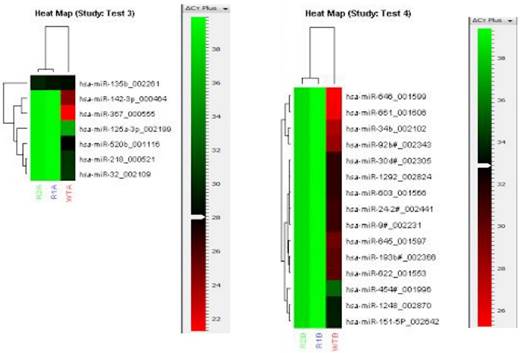
To identify the molecular alterations responsible for the drug resistance phenotype, miRNA expression profile of the oxaliplatin-resistant cells was compared with the parental cells using TaqMan Array Human MiRNA Cards containing 754 human miRNA assays. The array for the oxaliplatin-resistant cells was performed in duplicates and the duplicates showed good correlation with each other (Fig. 3). The miRNA profiles were compared between the resistant and parental cells, and 55 significantly upregulated miRNA in the resistant cell line were identified (Fig. 3). In addition, a further 22 miRNA were significantly downregulated in the resistant cell line compared to the parental cell line (Fig. 4). More miRNAs were upregulated than downregulated in the resistant cell line, suggesting that upregulation of miRNAs, resulting in downregulation of oncogenes, may be the dominant pathway in chemoresistance.
Drug sensitivity towards oxaliplatin, SN-38 and 5-FU for the parental and resistant cell lines. Cells were exposed to a range of drug concentrations for 72 h and cell viability was assessed by MTS assay. Results of one representative experiment out of three are shown. Values are mean ± standard deviation of triplicate measurements. The dotted lines represent the parental cell line. The solid lines represent the resistant cell line. * p <0.05, *** p <0.001.
Migration, invasion and tumor sphere formation of the parental and resistant cell lines. (A) Migration of the parental and resistant cell lines using the ibidi culture insert. Pictures from one representative experiment out of three are shown. The margin between the area of the cells and the wound is delineated with a red line. The area of the wound was quantified as described in the methods section. The percentage of the wound area out of the total area is shown at the top right corner of each representative picture at day 0, day 3, and day 5. The bars represent mean ± standard deviation of three independent experiments. *** p <0.001. (B) Invasion of the parental and resistant cell lines using the ECMatrix Cell Invasion Assay. Pictures from one representative experiment out of three are shown. The degree of invasion was quantified as described in the methods section. The bars represent mean ± standard deviation of three independent experiments. *** p <0.001. (C) Sphere formation by the parental and resistant cell lines. Pictures from one representative experiment out of three are shown. The degree of sphere formation was quantified as described in the methods section. The bars represent mean ± standard deviation of three independent experiments. *** p <0.001.
Heat maps of the miRNAs significantly upregulated in the resistant cell line compared to the parental cell line in the TaqMan Human MiRNA Array. The heat map shows relative miRNA expression levels to a red-green color scale with red showing high expression level, green showing low expression level and black showing average expression level. Pool A (Test1) and Pool B (Test2) miRNAs were analyzed separately. Each row represents a single miRNA and each column represents a sample. The resistant cell line was analyzed in duplicates (R1A/B and R2A/B); the parental cell line is indicated as WTA/B. The red-green color scale relative to the Cq levels are shown on the right of each heat map.
Heat maps of the miRNAs significantly downregulated in the resistant cell line compared to the parental cell line in the TaqMan Human MiRNA Array. The heat map shows relative miRNA expression levels to a red-green color scale with red showing high expression level, green showing low expression level and black showing average expression level. Pool A (Test 3) and Pool B (Test 4) miRNAs were analyzed separately. Each row represents a single miRNA and each column represents a sample. The resistant cell line was analyzed in duplicates (R1A/B and R2A/B); the parental cell line is indicated as WTA/B. The red-green color scale relative to the Cq levels are shown on the right of each heap map.
Validation of miRNA expression by RT-qPCR
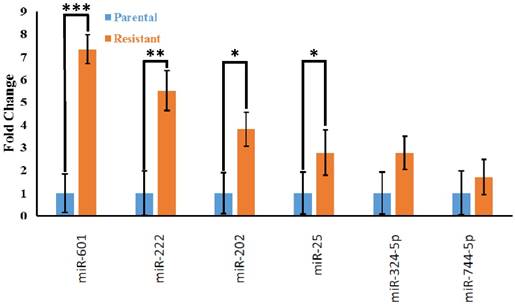
To independently validate the differential expression of miRNAs identified by the TaqMan Array, we chose 24 candidate overexpressed miRNAs (miR-15b, miR-19a, miR-100-3p, miR-106a, miR-106b-3p, miR-125b, miR-126, miR-135b-3p, miR-139-5p, miR-185, miR-192, miR-193a-5p, miR-196b, miR-202, miR-215, miR-222, miR-25, miR-30a, miR-30d, miR-324-5p, miR-584, miR-601, miR-639, miR-744-5p) for RT-qPCR analysis. We found that the expression of 4 miRNAs (miR-601, miR-222, miR-202, and miR-25) were significantly different (p <0.05) between the resistant and parental cell lines (Fig. 5).
In silico analyses of potential mRNA targets
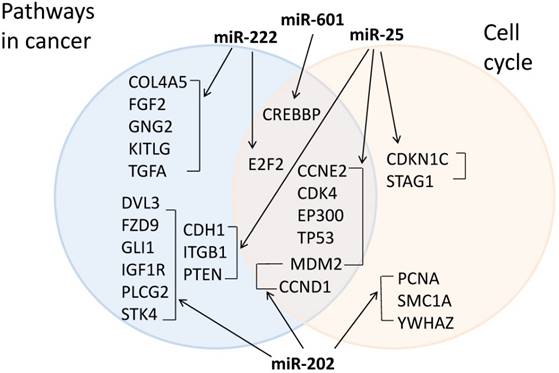
We further collected experimentally known target mRNAs of the 4 miRNAs from miRTarBase and used the DAVID functional annotation tool to perform pathway analysis on the target mRNAs. The top KEGG pathways identified were pathways in cancer and cell cycle, suggesting that these pathways may be important in chemoresistance acquisition. Out of 263 possible targets, 22 target genes were in pathways in cancer and 13 were in the cell cycle pathway (Fig. 6).
RT-qPCR validation of miRNA array results in HCT116 cell line. The bars represent mean ± standard deviation of three independent experiments. MiRNAs were normalized to the mean miRNA expression level of all the 24 miRNAs tested. The fold change of miRNA expression of the resistant cell line (orange bars) was expressed relative to that of the parental cell line (blue bars). * p <0.05, *** p <0.001.
Target mRNAs in cancer and cell cycle pathways. The target mRNA of the 4 validated miRNAs were collected from miRTarBase and KEGG pathway analysis was performed using DAVID. Target mRNAs in cancer pathways are in the blue circle (left) and target mRNAs in cell cycle pathway are in the pink circle (right). Target mRNAs that are in both pathways are in the intersection (middle).
Discussion
Acquisition of resistance to chemotherapeutic agents is one of the main problems in cancer treatment. In this study we focused on oxaliplatin resistance in CRC. We assessed the migratory and invasive ability of the HCT116 colorectal cell line with acquired resistance to oxaliplatin and its parental line. Our observations suggest that resistance acquisition is associated with increased invasive and migratory capacity, indicating increased metastasis ability. Oxaliplatin-resistant HT29 and KM12L4 colorectal cells were also observed to undergo epithelial-mesenchymal transition (EMT) to acquire a more invasive and migratory phenotype by Yang et al. [19]. EMT is a process through which cells switch from an epithelial state to a more primitive mesenchymal state to facilitate invasion and migration [20]. The chemoresistance-induced migratory and invasive phenotype observed suggests that chemoresistant cancer cells may be better able to form metastases, and that targeting the process of EMT could aid in reversing chemoresistance.
We observed an increased ability of the oxaliplatin-resistant HCT116 cells to form spheres under serum-free conditions, suggesting an enrichment of CSCs induced by the acquisition of chemoresistance. Oxaliplatin-resistant HT29 cells were also observed to acquire a CSC phenotype by Dallas et al. [21]. CSCs are cells with indefinite potential for self-renewal to drive tumorigenesis [22]. Tumor cells that are resistant to chemotherapy may represent a subpopulation of cells from the original tumor, commonly referred to as CSCs [23]. The CSC phenotype observed in the oxaliplatin-resistant cells suggests that similar molecular mechanisms may be involved in resistance acquisition and transformation to CSCs.
In this study we comprehensively profiled the expression of 754 human miRNAs in the resistant and parental cell line. Out of 754 miRNAs, 55 showed upregulated expression in the resistant cells compared to the parental cell line. The upregulation of multiple miRNAs in the resistant cells suggests that multiple complex molecular processes are involved in the acquisition of resistance. Of the 55 miRNAs, 24 miRNAs were validated by RT-qPCR and 4 (miR-601, miR-222, miR-202, and miR-25) were found to be significantly upregulated in the oxaliplatin-resistant cell line compared to the parental cells. The most highly upregulated miRNA, miR-601, had been observed to be downregulated in the plasma of colorectal cancer patients compared to healthy controls [24]. The expression of miR-601 was also found to be downregulated in breast cancer tissues compared to adjacent non-cancerous breast tissues overexpression of miR-601 suppressed breast cancer cell migration and invasion [25]. These findings appear to suggest a role for miR-601 as a tumor suppressor and a biomarker for good prognosis, which is in contrast to our observations in the oxaliplatin-resistant HCT116 cells. Widespread context dependency of miRNA-mediated regulation has been described [26], therefore it is possible that the differences between our observations and other studies for the role of miR-601 in cancer may be context dependent. Global profiling of the molecular pathways regulated by miR-601 identified multiple pathways including upregulation of actin cytoskeleton, downregulation of Fas-induced apoptotic pathway, and downregulation of NF-kappaB expression [27]. Upregulation of the actin cytoskeleton may play a role in increased invasiveness and migratory capacity observed in the resistant cells, while downregulation of apoptosis may play a role in resistance to apoptotic pathways triggered by oxaliplatin-induced DNA damage.
MiR-222 has been previously identified to be involved in oxaliplatin resistance in colorectal cancer [28]. The downstream target pathways involved in platinum-based anti-cancer drugs may include the Akt-mTOR pathway [29] and the ATP-binding cassette (ABC) transporter, ABCG2 [30].
Pathak et al. found that miR-202 was upregulated in HCT116p53+/+ cells after radiation treatment [31]. However, Wang et al. showed downregulation of miR-202 in colorectal cancer tissues compared to non-cancerous tissues and suggested that miR-202 may function as a tumor suppressor by suppressing cell proliferation [32]. Decreased cell proliferation has been associated with an increase in chemoresistance through miR-215 [33], therefore reduced cell proliferation and resistance acquisition may share common molecular pathways.
Neerincx et al. found that miR-25 is highly expressed in colorectal cancer and their metastases by next-generation sequencing [34]. Furthermore, miR-25 was shown to enhance cell proliferation, migration and invasion of gastric cancer cells [35]. However, ovarian cancer non-responders to carboplatin therapy were shown to have decreased levels of miR-25 [36]. In addition, miR-25 was found to be downregulated in cisplatin-resistant cervical cancer cells and overexpression of miR-25 reversed the EMT phenotype of the cisplatin-resistant cervical cancer cells [37]. MiRNAs can influence drug resistance not only in a drug-specific manner but also in a cell-specific manner [38]. Perhaps the opposing roles for miR-25 observed in these studies relative to our observations may be due to cell-specific and/or drug-specific effects.
It would be necessary to confirm that the miRNAs that are upregulated are responsible for the increased invasive and stem cell formation phenotypes observed. A limitation of this study is that only one cell line was studied. Jensen et al. profiled the transcriptome of 3 different colorectal cancer oxaliplatin- and irinotecan-resistant cell lines and found that each cell line had a distinctive resistance gene expression profile [39]. Therefore the molecular alterations observed in the oxaliplatin-resistant HCT116 cells may not be generalizable to all colorectal cancers. Another limitation of this study is that no in vivo surgically resected human colorectal cancer tissue samples were studied. Therefore, our findings need to be interpreted with caution when extrapolating clinical relevance from cell line data. Because of this limitation, the usefulness of this study is limited to an exploratory, hypothesis-generating analysis rather than an endpoint analysis.
In conclusion, this study identified several candidate miRNAs that may be involved in the mechanism of acquisition of resistance to oxaliplatin. Functional studies on the miRNAs and their target mRNA are necessary to discover the functional pathways to chemoresistance in colorectal cancer.
Abbreviations
CRC: Colorectal cancer; CSC: Cancer stem cell; EMT: epithelial to mesenchymal transition; MTS: 3-(4,5-dimethylthiazol-2-yl)-5-(3-carboxymethoxyphenyl)-2-(4-sulfophenyl)-2H-tetrazolium).
Acknowledgements
This study was supported by a National Medical Research Council (NMRC) Clinician New Investigator Grant (CNIG) (NMRC/CNIG/1119/2014) and a National University Health System (NUHS) Bench to Bedside Grant (NUHSRO/2014/019/BBP/04).
Authors' Contributions
SML, KT: concept and design of study; BK, KWL, KT: literature search, BK, KWL, MSM, SL, WEO, HLW, YYC: experimental studies, data acquisition, data analysis, and statistical analysis; BK, KT: manuscript preparation; SML, ESK: manuscript editing and manuscript review.
Competing Interests
The authors have declared that no competing interest exists.
References
1. Siegel R, Desantis C, Jemal A. Colorectal cancer statistics, 2014. CA Cancer J Clin. 2014;64:104-17
2. Schmoll HJ, Van Cutsem E, Stein A. et al. ESMO Consensus Guidelines for management of patients with colon and rectal cancer. A personalized approach to clinical decision making. Ann Oncol. 2012;23:2479-516
3. Cassidy J, Tabernero J, Twelves C. et al. XELOX (capecitabine plus oxaliplatin): active first-line therapy for patients with metastatic colorectal cancer. J Clin Oncol. 2004;22:2084-91
4. Li YH, Luo HY, Wang FH. et al. Phase II study of capecitabine plus oxaliplatin (XELOX) as first-line treatment and followed by maintenance of capecitabine in patients with metastatic colorectal cancer. J Cancer Res Clin Oncol. 2010;136:503-10
5. Goldberg RM, Sargent DJ, Morton RF. et al. A randomized controlled trial of fluorouracil plus leucovorin, irinotecan, and oxaliplatin combinations in patients with previously untreated metastatic colorectal cancer. J Clin Oncol. 2004;22:23-30
6. Meyerhardt JA, Mayer RJ. Systemic therapy for colorectal cancer. N Engl J Med. 2005;352:476-87
7. Martinez-Balibrea E, Martínez-Cardús A, Ginés A. et al. Tumor-related molecular mechanisms of oxaliplatin resistance. Mol Cancer Ther. 2015;14:1767-76
8. He L, Hannon GJ. MicroRNAs: small RNAs with a big role in gene regulation. Nat Rev Genet. 2004;5:522-31
9. Calin GA, Croce CM. MicroRNA signatures in human cancers. Nat Rev Cancer. 2006;6:857-66
10. Donzelli S, Mori F, Biagioni F. et al. MicroRNAs: short non-coding players in cancer chemoresistance. Mol Cell Ther. 2014;2:16
11. Alian OM, Azmi AS, Mohammad RM. Network insights on oxaliplatin anti-cancer mechanisms. Clin Transl Med. 2012;1:26
12. Wimasis. WimScratch: Wound healing assay image analysis solution; Release 4.0, 2016. https://www.wimasis.com/en/products/9/WimScratch
13. Mestdagh P, Van Vlierberghe P, De Weer A. et al. A novel and universal method for microRNA RT-qPCR data normalization. Genome Biol. 2009;10:R64
14. Wan G, Lim QE, Too HP. High-performance quantification of mature microRNAs by real-time RT-PCR using deoxyuridine-incorporated oligonucleotides and hemi-nested primers. RNA. 2010;16:1436-45
15. Livak KJ, Schmittgen TD. Analysis of relative gene expression data using real-time quantitative PCR and the 2(-Delta Delta C(T)) Method. Methods. 2001;25:402-8
16. Chou CH, Chang NW, Shrestha S. et al. miRTarBase 2016: updates to the experimentally validated miRNA-target interactions database. Nucleic Acids Res. 2016;44:D239-47
17. Huang da W, Sherman BT, Lempicki RA. Systematic and integrative analysis of large gene lists using DAVID bioinformatics resources. Nat Protoc. 2009;4:44-57
18. Huang da W, Sherman BT, Lempicki RA. Bioinformatics enrichment tools: paths toward the comprehensive functional analysis of large gene lists. Nucleic Acids Res. 2009;37:1-13
19. Yang AD, Fan F, Camp ER. et al. Chronic oxaliplatin resistance induces epithelial-to-mesenchymal transition in colorectal cancer cell lines. Clin Cancer Res. 2006;12:4147-53
20. Dontu G, Abdallah WM, Foley JM. et al. In vitro propagation and transcriptional profiling of human mammary stem/progenitor cells. Genes Dev. 2003;17:1253-70
21. Thiery JP. Epithelial-mesenchymal transitions in tumour progression. Nat Rev Cancer. 2002;2:442-54
22. Dallas NA, Xia L, Fan F. et al. Chemoresistant colorectal cancer cells, the cancer stem cell phenotype, and increased sensitivity to insulin-like growth factor-I receptor inhibition. Cancer Res. 2009;69(5):1951-7
23. Reya T, Morrison SJ, Clarke MF, Weissman IL. Stem cells, cancer, and cancer stem cells. Nature. 2001;414:105-11
24. Wang Q, Huang Z, Ni S. et al. Plasma miR-601 and miR-760 are novel biomarkers for the early detection of colorectal cancer. PLoS One. 2012;7:e44398
25. Hu JY, Yi W, Wei X. et al. miR-601 is a prognostic marker and suppresses cell growth and invasion by targeting PTP4A1 in breast cancer. Biomed Pharmacother. 2016;79:247-53
26. Erhard F, Haas J, Lieber D. et al. Widespread context dependency of microRNA-mediated regulation. Genome Res. 2014;24:906-19
27. Ohdaira H, Nakagawa H, Yoshida K. Profiling of molecular pathways regulated by microRNA 601. Comput Biol Chem. 2009;33:429-33
28. Jensen NF, Soekilde R, Stenvang J. et al. MicroRNAs related to intrinsic resistance to oxaliplatin and the irinotecan metabolite SN-38 in 10 colorectal cancer cell lines. Clin Oncol. 2012;30:524
29. Zeng LP, Hu ZM, Li K, Xia K. miR-222 attenuates cisplatin-induced cell death by targeting the PPP2R2A/Akt/mTOR Axis in bladder cancer cells. J Cell Mol Med. 2016;20:559-67
30. Zhao L, Ren Y, Tang H. et al. Deregulation of the miR-222-ABCG2 regulatory module in tongue squamous cell carcinoma contributes to chemoresistance and enhanced migratory/invasive potential. Oncotarget. 2015;6:44538-50
31. Pathak S, Meng WJ, Nandy SK. et al. Radiation and SN38 treatments modulate the expression of microRNAs, cytokines and chemokines in colon cancer cells in a p53-directed manner. Oncotarget. 2015;6:44758-80
32. Wang Q, Huang Z, Guo W. et al. microRNA-202-3p inhibits cell proliferation by targeting ADP-ribosylation factor-like 5A in human colorectal carcinoma. Clin Cancer Res. 2014;20:1146-57
33. Song B, Wang Y, Titmus MA. et al. Molecular mechanism of chemoresistance by miR-215 in osteosarcoma and colon cancer cells. Mol Cancer. 2010;9:96
34. Neerincx M, Sie DL, van de Wiel MA. et al. MiR expression profiles of paired primary colorectal cancer and metastases by next-generation sequencing. Oncogenesis. 2015;4:e170
35. Zhao H, Wang Y, Yang L, Jiang R, Li W. MiR-25 promotes gastric cancer cells growth and motility by targeting RECK. Mol Cell Biochem. 2014;385:207-13
36. Benson EA, Skaar TC, Liu Y. et al. Carboplatin with Decitabine Therapy, in Recurrent Platinum Resistant Ovarian Cancer, Alters Circulating miRNAs Concentrations: A Pilot Study. PLoS One. 2015;10:e0141279
37. Song J, Li Y. miR-25-3p reverses epithelial-mesenchymal transition via targeting Sema4C in cisplatin-resistance cervical cancer cells. Cancer Sci. 2017;108:23-31
38. Li H, Yang BB. Friend or foe: the role of microRNA in chemotherapy resistance. Acta Pharmacol Sin. 2013;34:870-9
39. Jensen NF, Stenvang J, Beck MK. et al. Establishment and characterization of models of chemotherapy resistance in colorectal cancer: Towards a predictive signature of chemoresistance. Mol Oncol. 2015;9:1169-85
Author contact
![]() Corresponding author: Dr. Karen Tan, Department of Laboratory Medicine, National University Hospital, Level 3 NUH Main Building, 5 Lower Kent Ridge Road, Singapore 119074, Singapore. Tel: +65 64070657; Fax: +65 6772 4407; Email: karen_ml_tanedu.sg.
Corresponding author: Dr. Karen Tan, Department of Laboratory Medicine, National University Hospital, Level 3 NUH Main Building, 5 Lower Kent Ridge Road, Singapore 119074, Singapore. Tel: +65 64070657; Fax: +65 6772 4407; Email: karen_ml_tanedu.sg.